
The recent pullback in AI-linked stocks this November offered a helpful reminder of how quickly narratives can shift. Much of the market’s strength this year has been fueled by excitement and investment around AI, which means any uncertainty in that space naturally catches attention.
Spending on AI initiatives appears to have played a major role in overall economic growth during the first half of the year, potentially accounting for a substantial share of inflation-adjusted GDP gains.
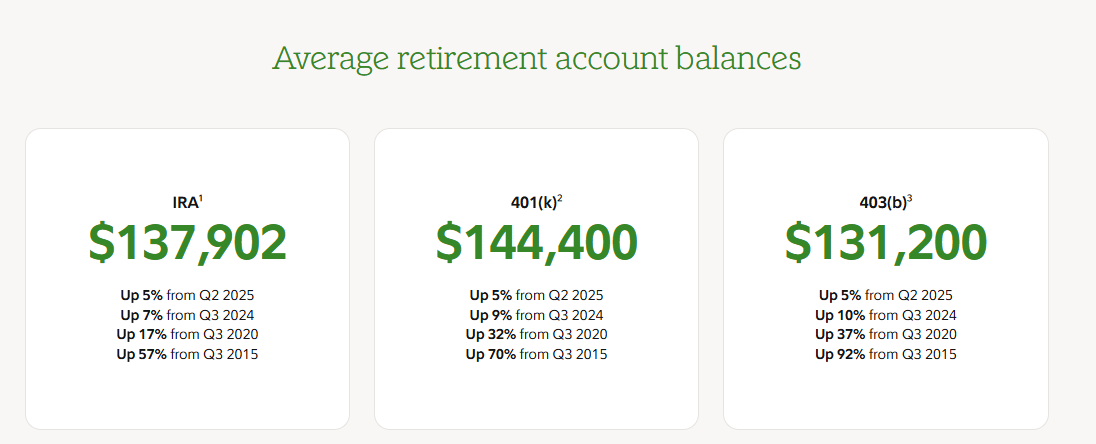
At the same time, the rise in AI-related market values has lifted household wealth, supporting stronger consumer spending in recent months. A common way to gauge household wealth is by looking at average retirement account balances. Fidelity’s Q3 2025 data shows that these balances have grown steadily over the years, reflecting a meaningful increase in overall savings.
Major Stock Indices
Through the month to date, the S&P 500 has dipped roughly 0.6% (11/26/25). Recent trading has been choppy. After an earlier pullback, the index found its footing and rebounded around November 24 and 25 as growing expectations for a potential Federal Reserve rate cut helped lift investor sentiment.
Here’s the scorecard, Year-to-date:
- S&P 500: 16.37%.
- Russell 2000 (US small companies): 11.88%
- MSCI EAFE (International Developed): 24.85%
- MSCI EM (Emerging Markets): 28.42%
That being said, the outperformance of a handful of growth-oriented companies has led the S&P 500 to become increasingly concentrated. A smaller group of large firms now drives a disproportionate share of overall index returns, which can create the impression of broad market strength even when performance is uneven beneath the surface. This kind of concentration isn’t unusual during periods of strong innovation or rapid sector growth, but it does mean that index performance is more sensitive to the swings of just a few major players.
The ‘Magnificent Seven’ Continue to Outpace the Broader US Market
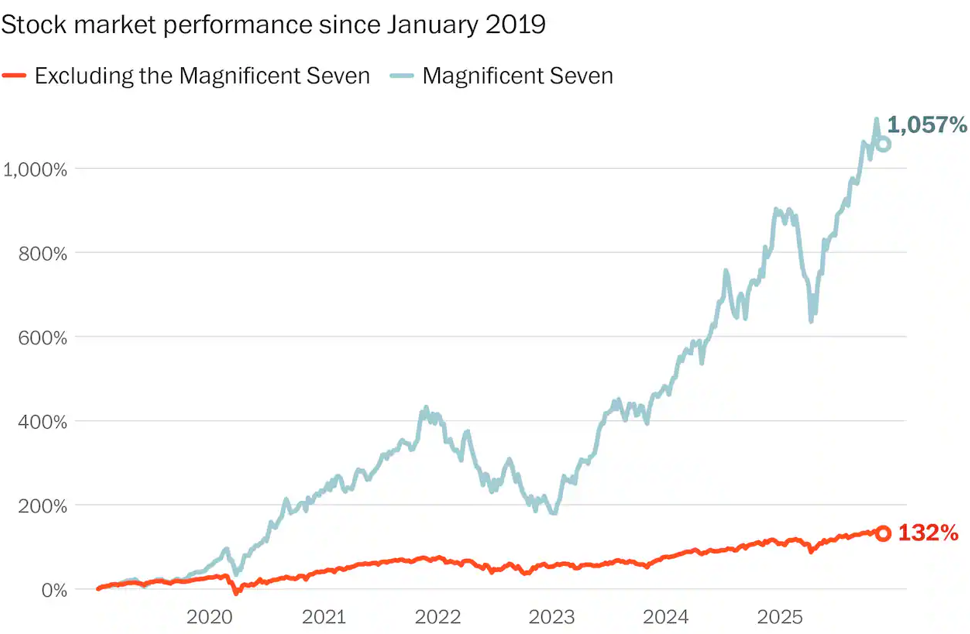
The ‘Magnificent 7’ consists of; Apple (AAPL), Microsoft (MSFT), Alphabet (GOOG / GOOGL), Amazon (AMZN), Meta Platforms (META), Nvidia (NVDA), Tesla (TSLA).
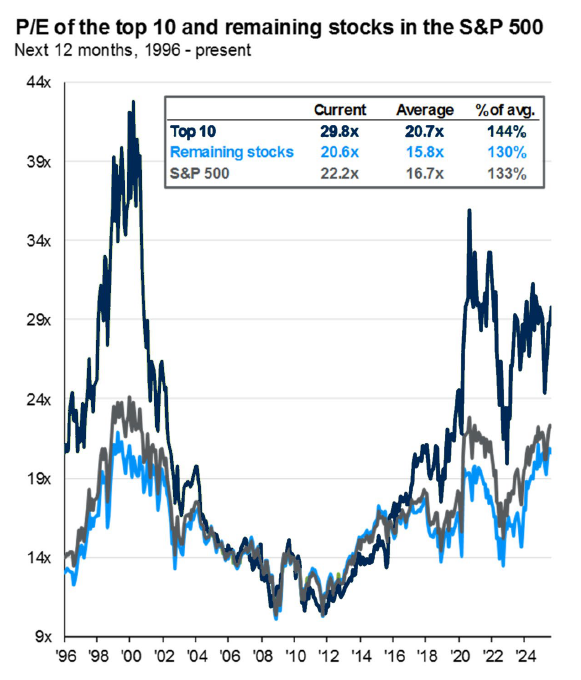
Valuations: Is this AI-driven market reminiscent of the ‘dot-com bubble’ of 2000?
The price-to-earnings ratio, or P/E, is a way to see how much investors are willing to pay for a company’s profits. For example, a P/E of 20 means people are paying $20 for every $1 the company earns.
P/E ratios give a quick sense of whether a stock feels expensive or cheap compared with its earnings. Right now, P/E ratios are higher than average, reflecting optimism about growth (AI innovations), though the current levels are not as extreme as those seen during the dot-com bubble (2000).
Keep in mind, P/E is just one tool, and does not necessarily tell the full story of how the market is valuing a specific company. It works best when used with other measures to get a clearer picture of a company’s value.
While valuations and concentration levels are elevated, it is important to recognize that today’s largest companies are also among the most profitable in history.
Their dominant market positions, strong balance sheets, and recurring revenue models have supported earnings resilience even in volatile environments.
Historically, investing at market highs has not significantly impaired long-term portfolio outcomes, as subsequent returns are driven more by earnings growth and economic expansion than by starting valuation alone.
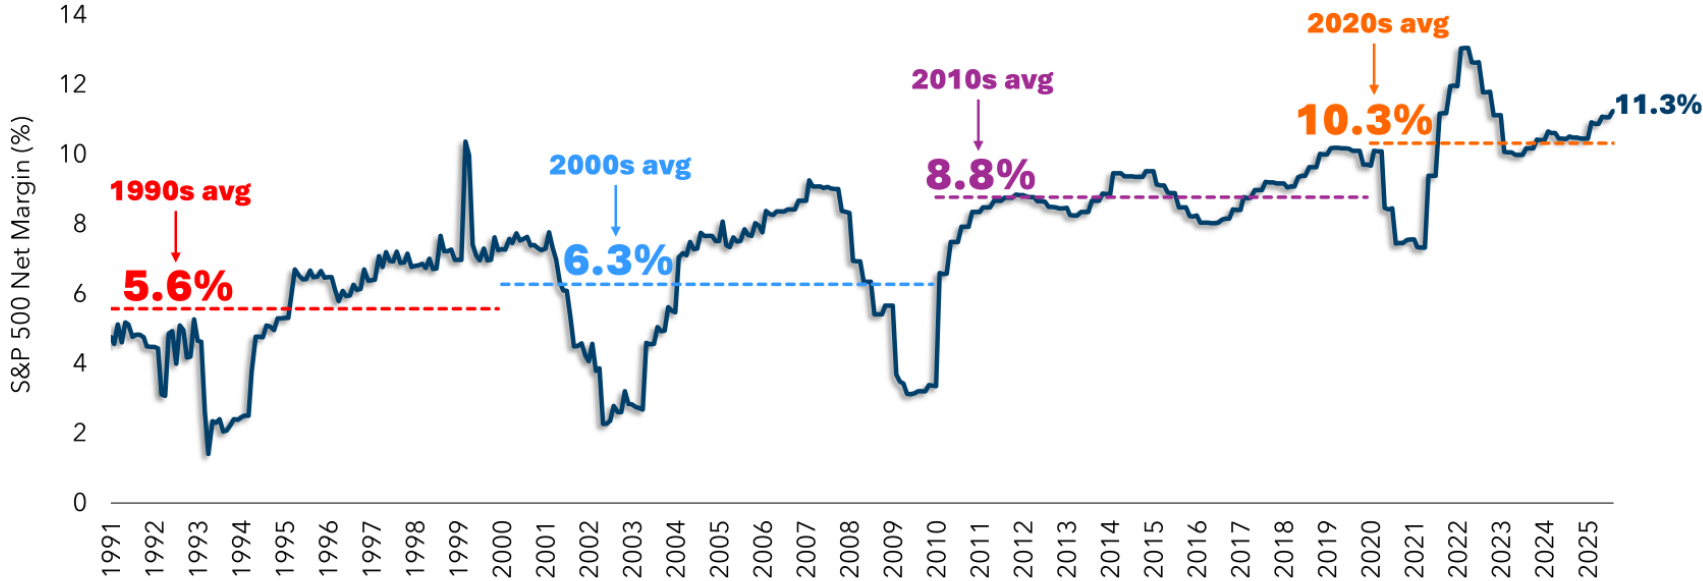
S&P 500 Net Earnings Margins (1991-2025) – Source: Ritholtz Wealth Management